


Fourier Trading
I came across Skyblock.finance, and I didn't realize how seriously people were taking this game. They were spending money on spreadsheets, but using TradingView on a video game? That's intense. Anyway, turns out you can download their data, although they don't have an official API. You can go under the network tab, inspect element, and figure out how to send an API request so that they give you all their data. So I did that.
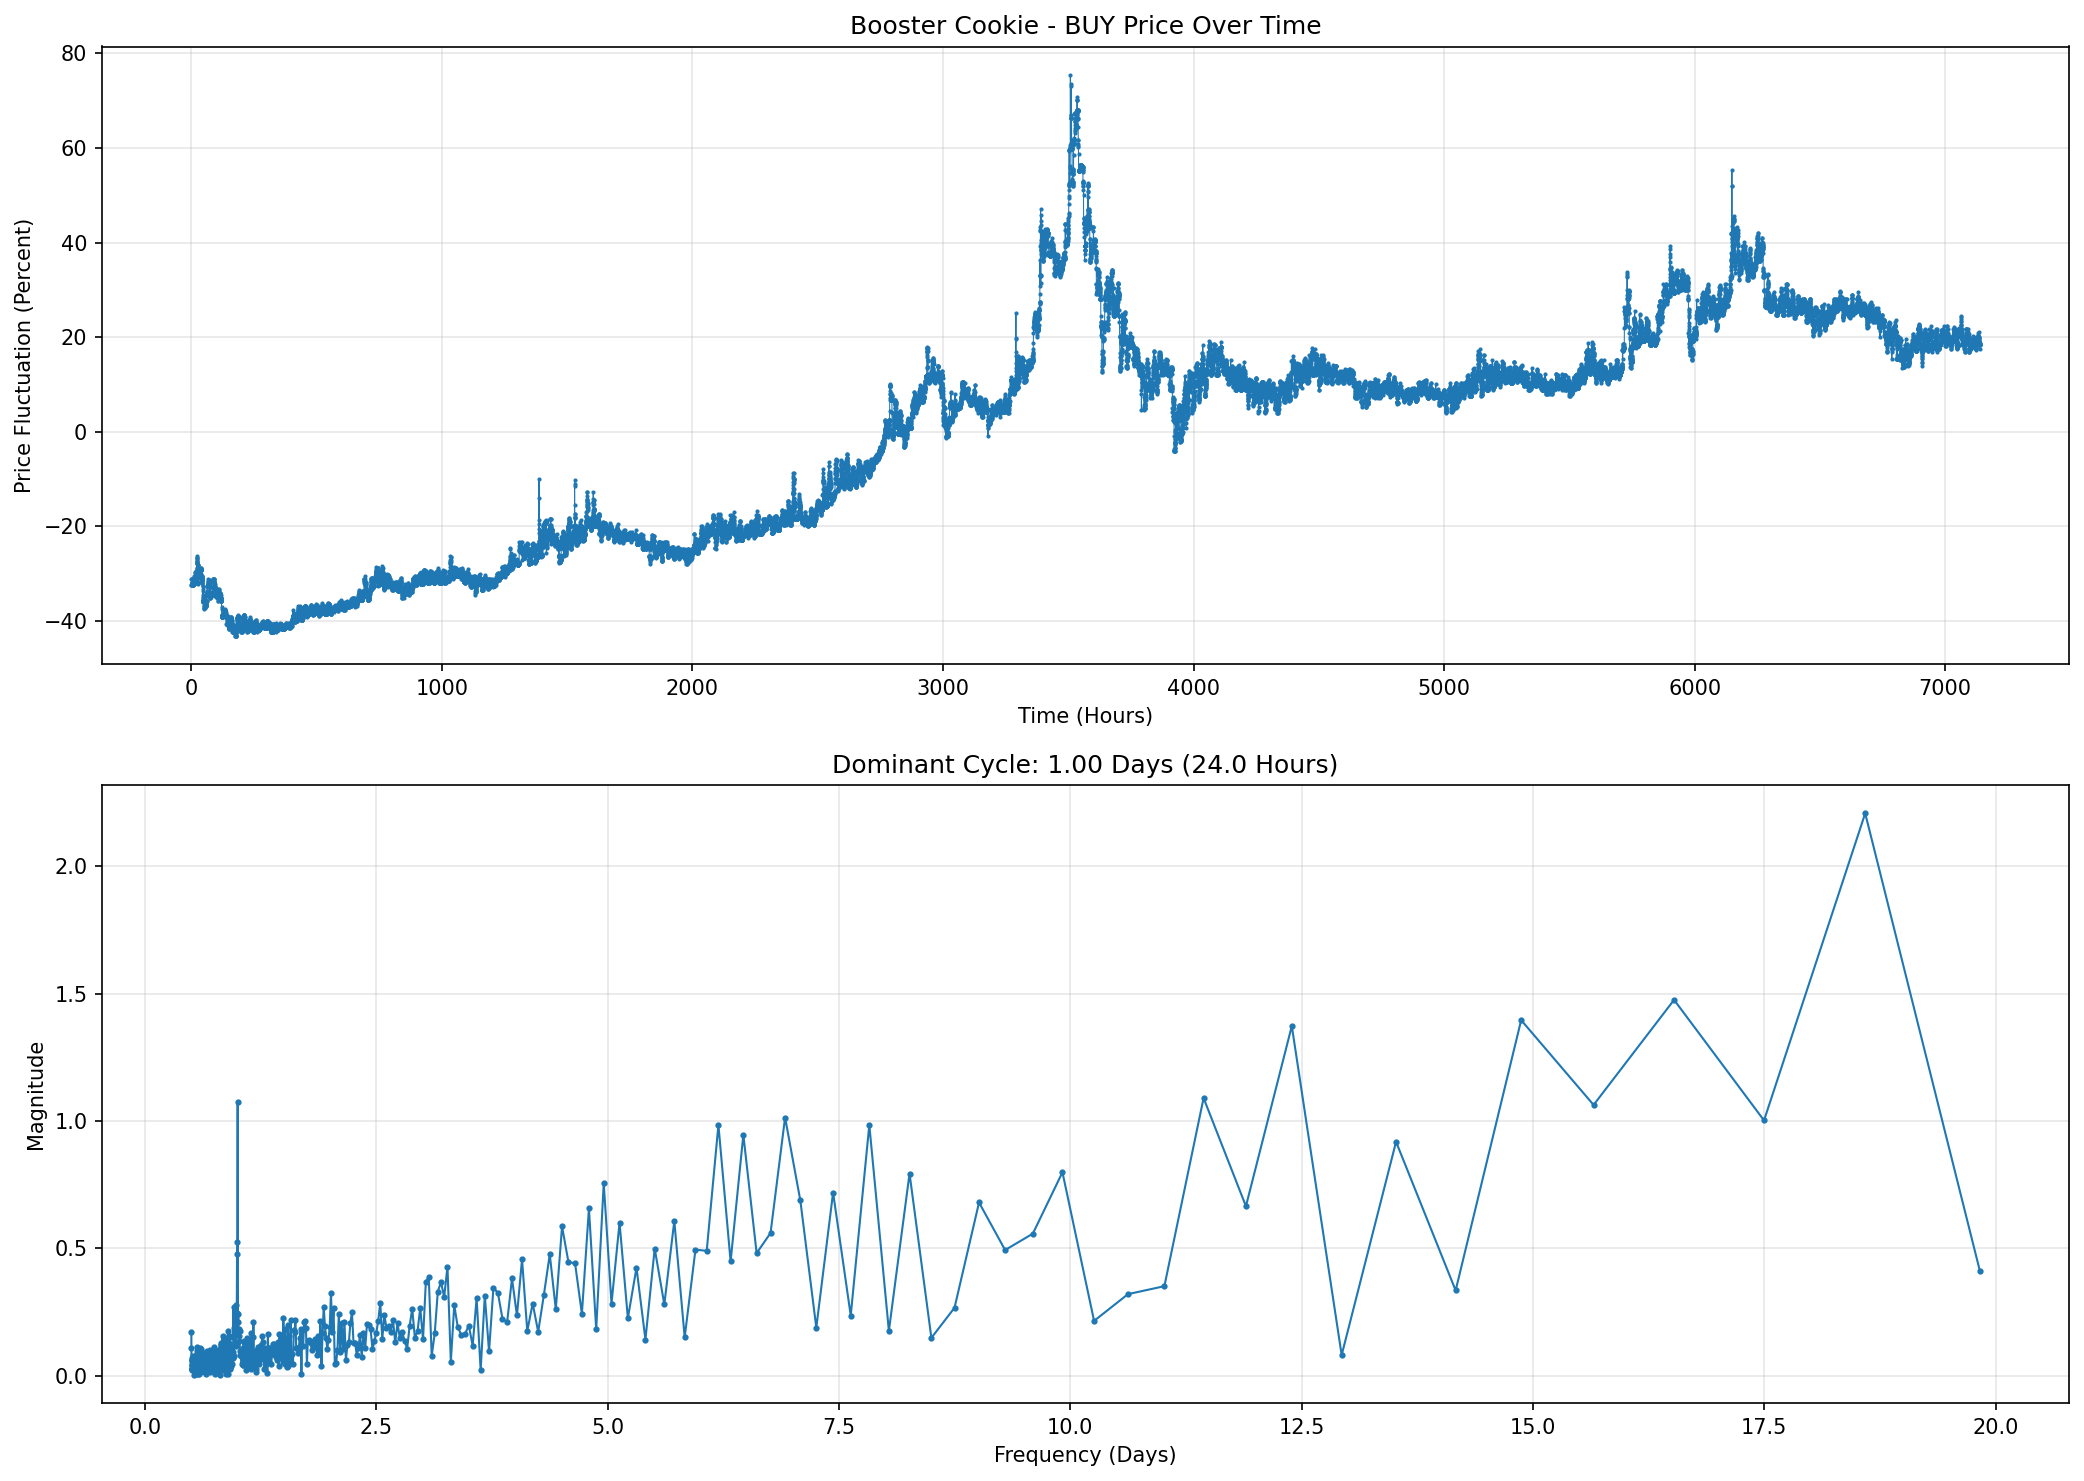
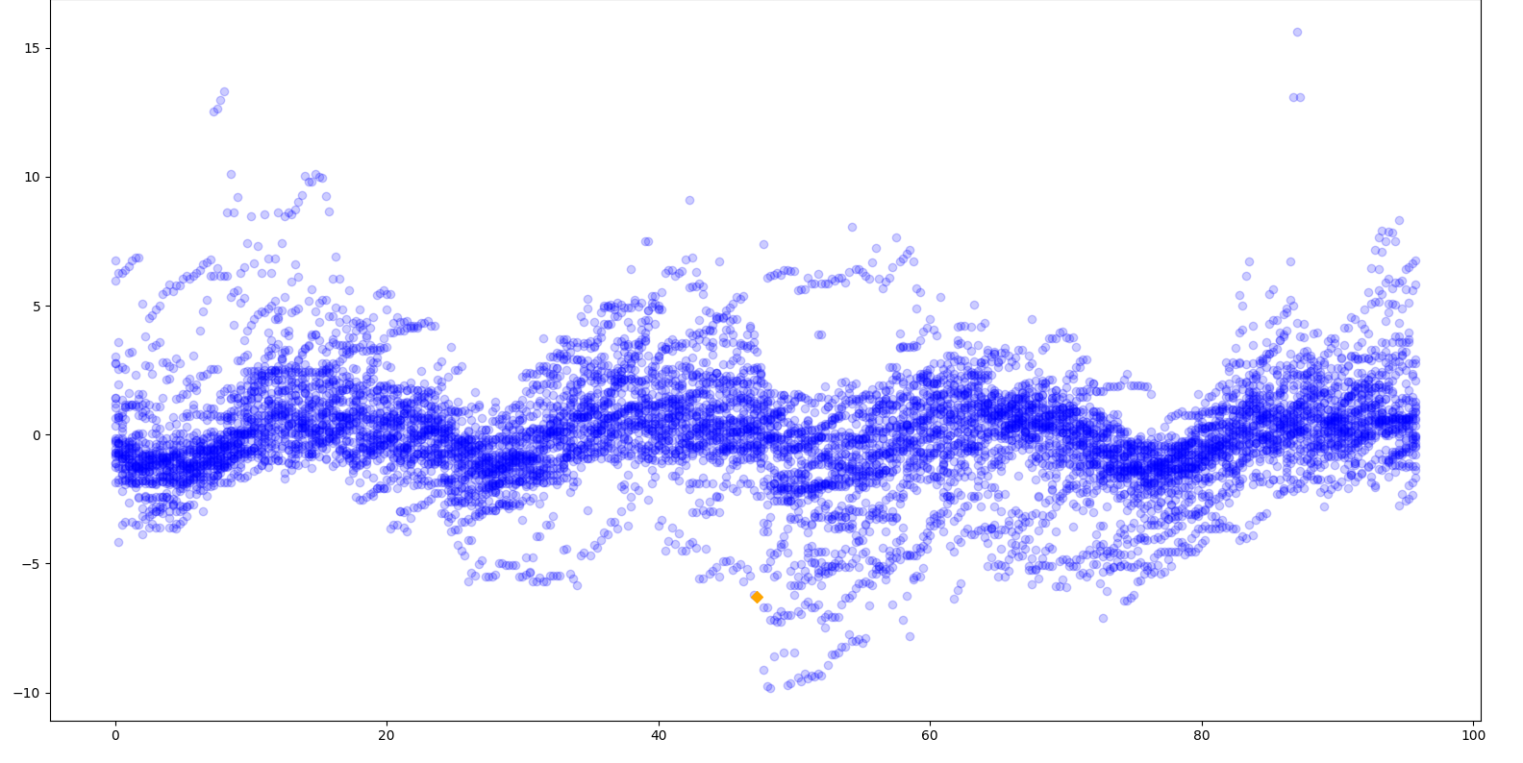
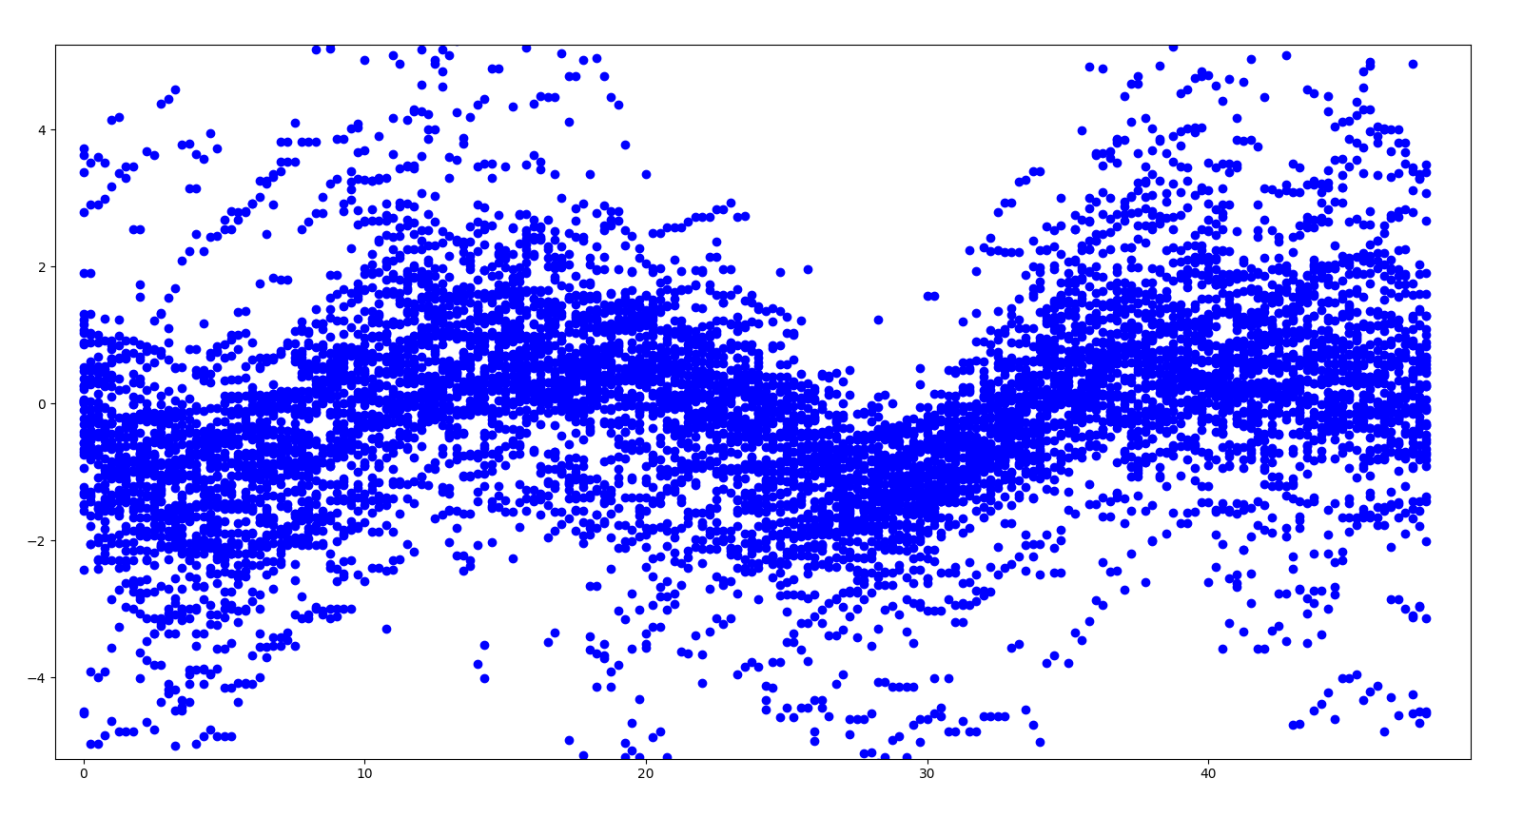
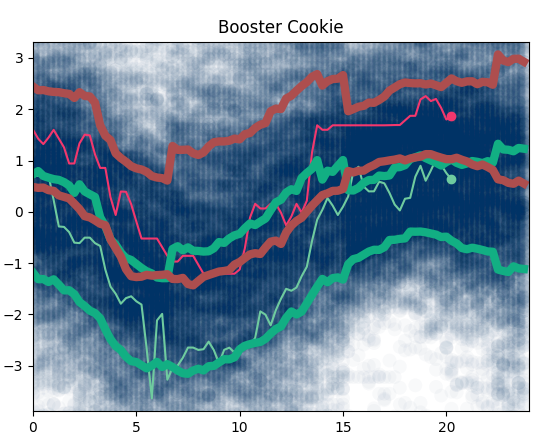
Around that time, I watched a 3Blue1Brown video on Fourier transforms. I thought, "You know what else I could apply this to besides pressure over time? Price over time." So I tried it with the most popular item, the Booster Cookie. That bad boy had a strong sine wave with a frequency of exactly 1 day. I graphed a scatter plot of normalized price over time modulo 4, 2, then 1 day, and the pattern was undeniable.
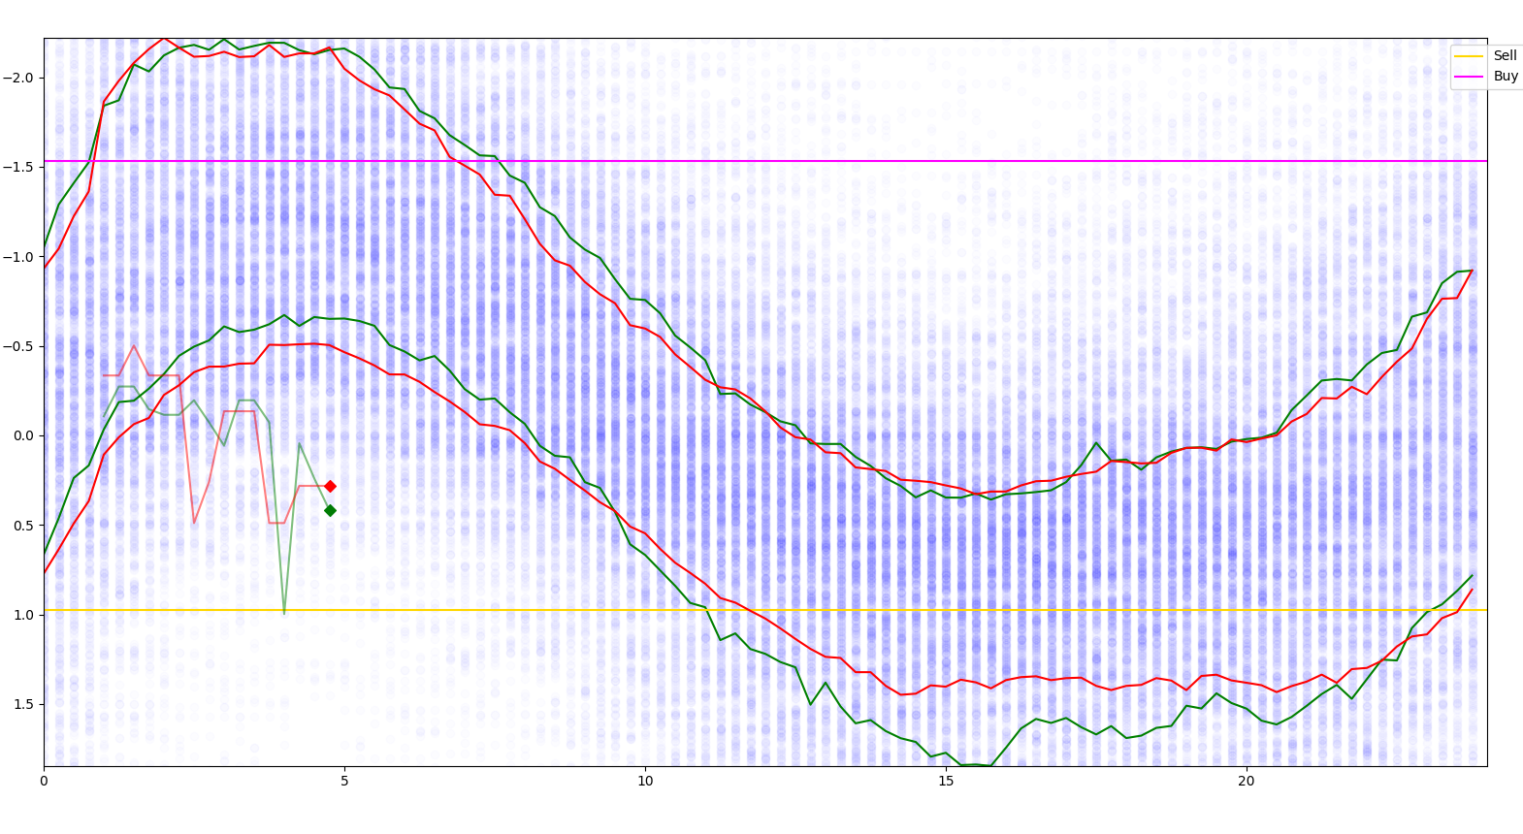
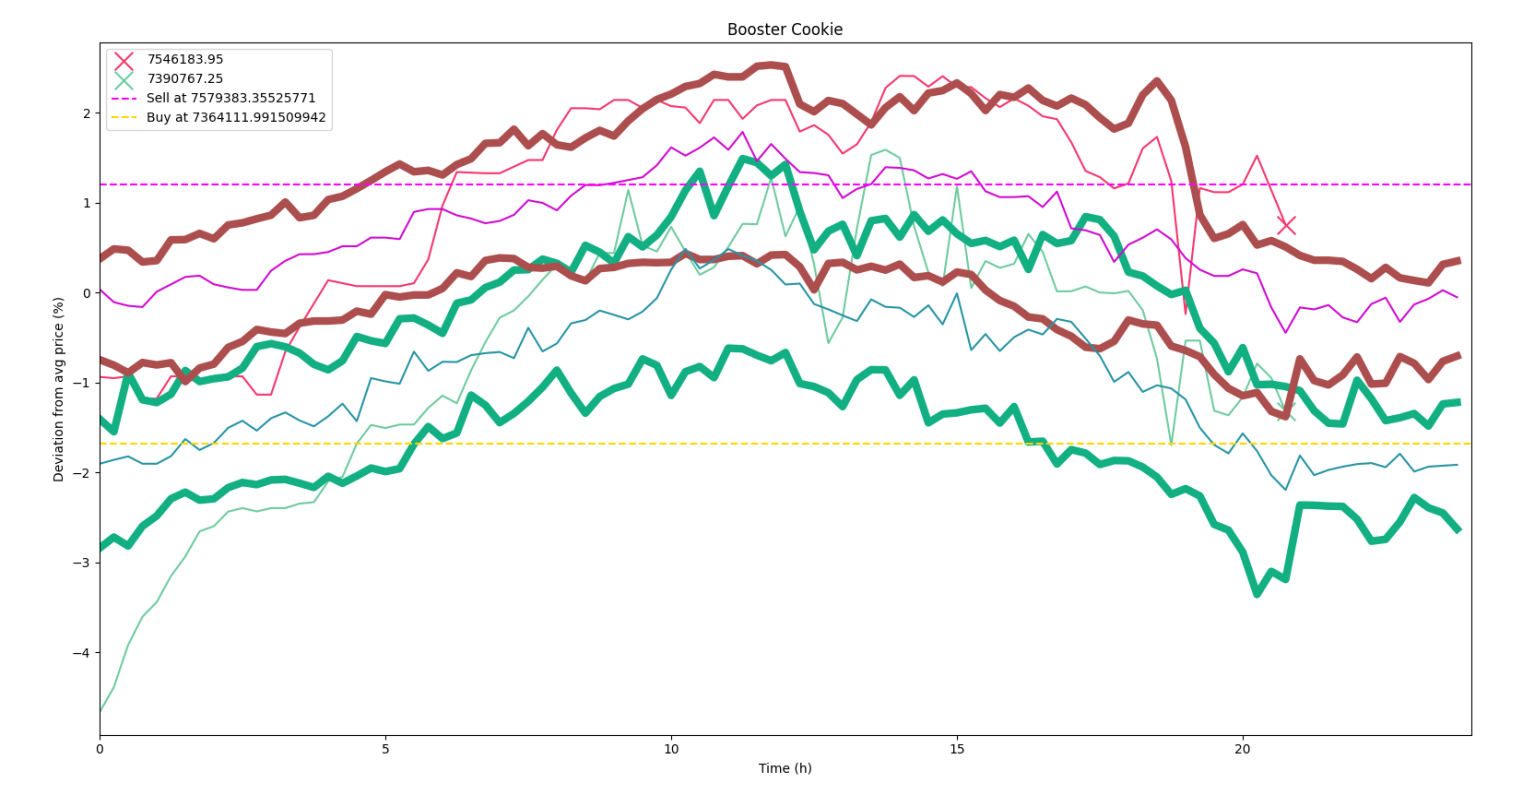
I couldn't believe nobody was arbitraging this. The price would just swing through predictable cycles. I started placing counter-orders during the dips, and I was making a killing. It was incredible!
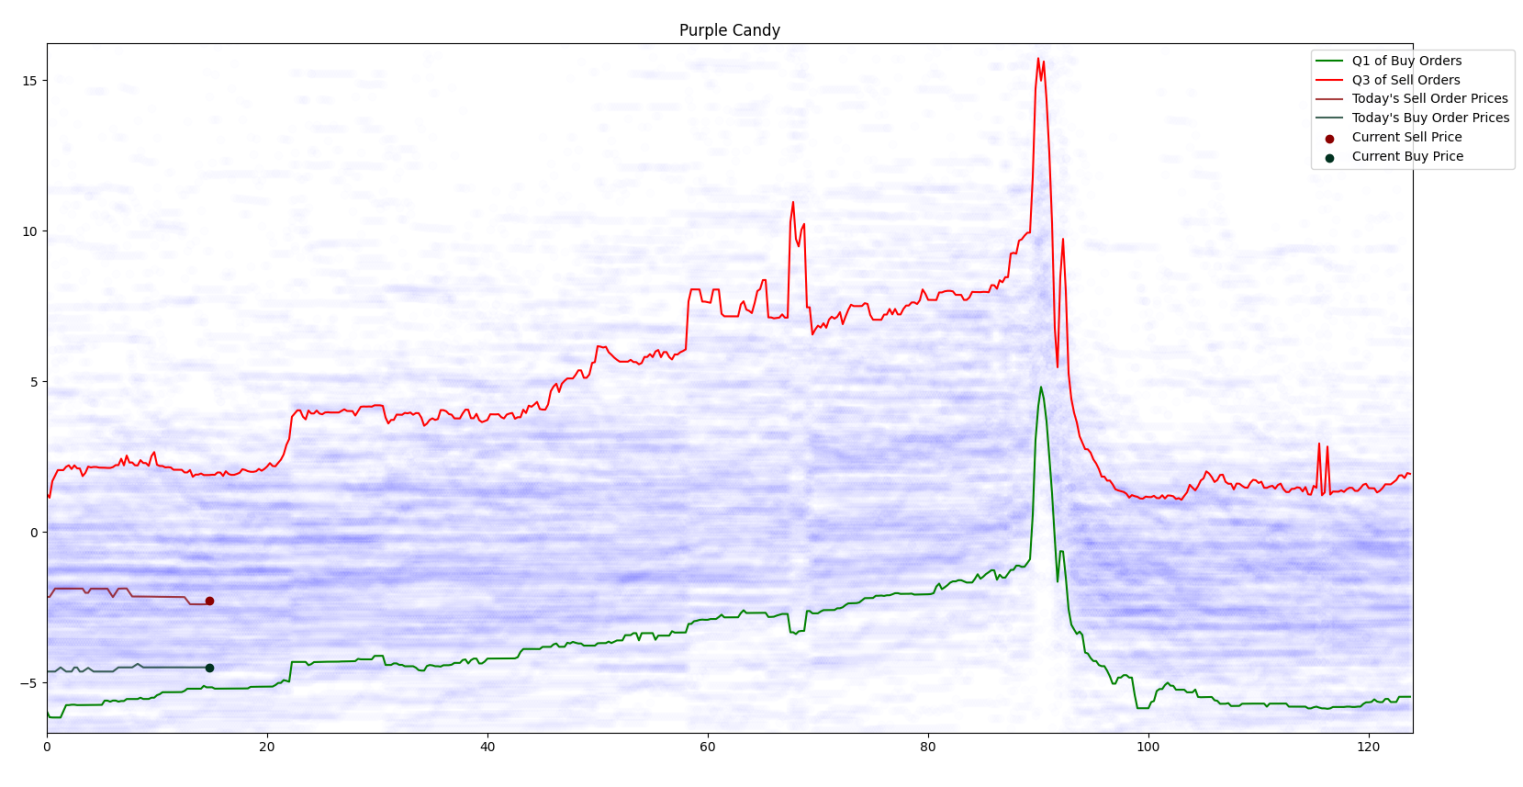
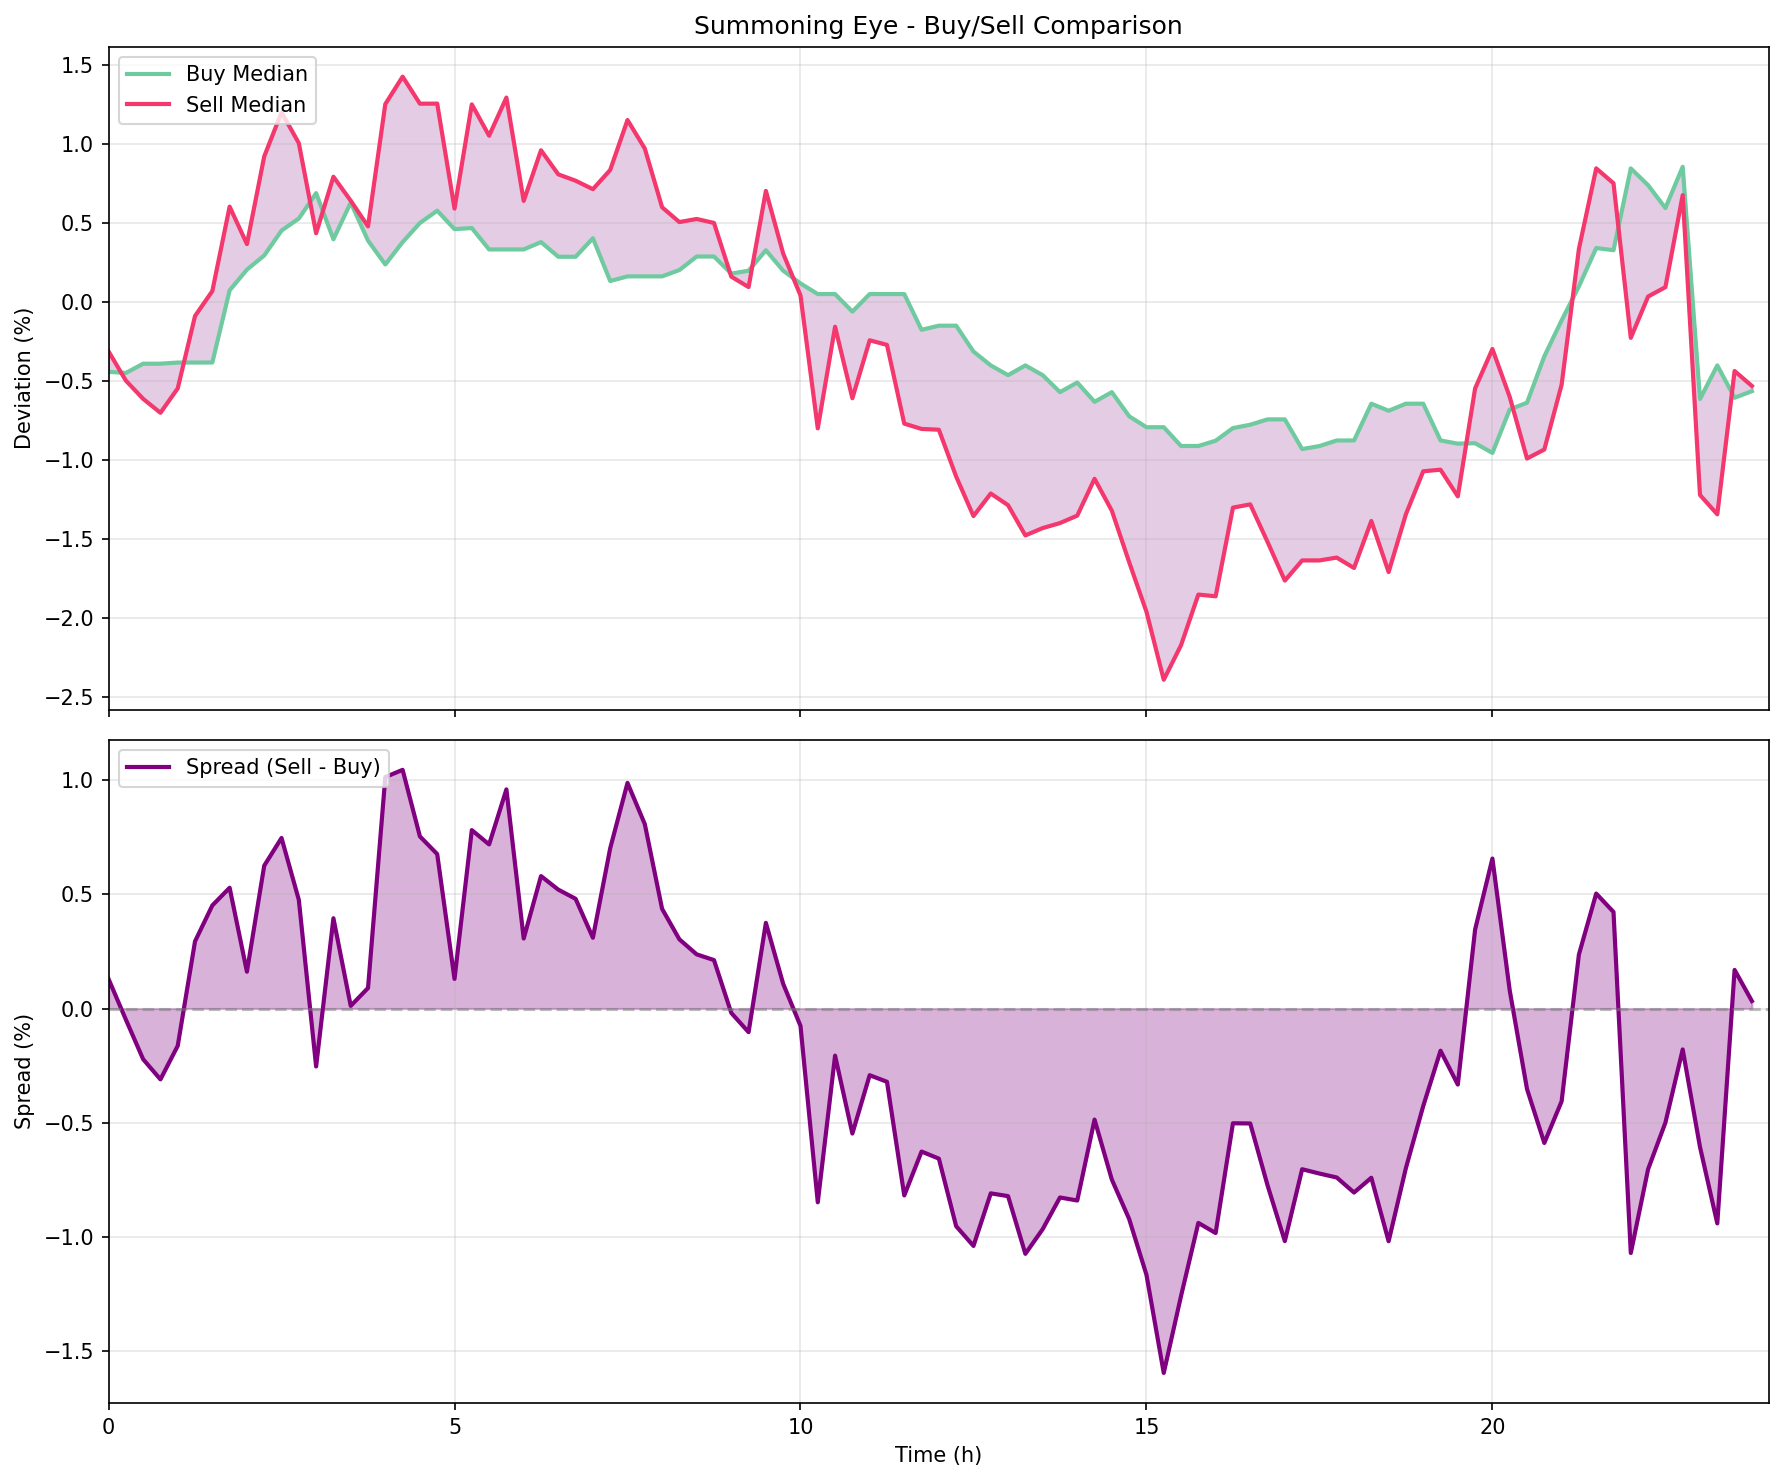
Items had their own obvious behaviors as well...
You could hop on for 10 minutes a day, trade some stuff, hop off... but only for so long. Eventually I got tired of the game.